


How to Read A Carbon Report: A Guide to Scope Event Reporting
You've measured your event's carbon footprint and opened your first carbon report. There are numbers, charts, percentages and recommendations in front of you, but where should you start?
If you're new to carbon reporting, understanding what the results mean can take a little getting used to. What does tCO₂e stand for? How do you know which activities produce the most emissions? And what should you actually do with the information?
Learning how to read a carbon report is about more than understanding the total figure. It's about recognising where emissions come from, checking the information behind the results and identifying opportunities to make informed decisions for future events.
In this guide, we'll walk through the key parts of an event carbon report using Scope Carbon Tracking's event reporting platform as a practical example. Whether you're an event organiser, venue manager or part of an agency team, you'll learn how to interpret your carbon footprint results and make better use of the information you've collected.
What Is a Carbon Footprint Report?
A carbon footprint report summarises the greenhouse gas emissions associated with an organisation, activity or event over a defined period.
For events, this might include emissions from venue energy, attendee travel, accommodation, production materials, catering, waste and supplier transport. The exact categories covered depend on the event and the information included in the calculation.
An event carbon report helps answer three questions:
How much? What is the estimated total carbon footprint of the event?
Where from? Which activities contribute the most to those emissions?
What next? Which areas are worth investigating when planning future events?
The report provides a starting point for understanding your event's emissions. It doesn't automatically mean every activity has been measured, or that emissions have already been reduced.
If you're still collecting information, our guide on how to measure and reduce your event carbon footprint explains the process leading up to your first report.
Step 1: Read the Headline Results First
When you open a Scope event carbon report, the Headline Results section provides a useful starting point.
Rather than trying to interpret every chart immediately, begin with the summary figures. In the Scope report shown here, these include:
Total event footprint: The estimated emissions associated with the activities included in the report.
Emissions per attendee: A figure that relates the reported footprint to attendance.
Biggest module: The activity category contributing the largest share of measured emissions.
Largest scope: The largest contribution when emissions are grouped by Scope 1, 2 and 3.
Together, these figures give you an initial picture of your event's carbon footprint before you explore the individual categories.

What does tCO₂e mean?
Your total carbon footprint is expressed in tonnes of carbon dioxide equivalent (tCO₂e).
Carbon dioxide equivalent is a common unit used to express the climate impact of different greenhouse gases. It allows emissions involving different gases to be combined into one figure.
For example, if an event carbon report shows 24 tCO₂e, that represents an estimated climate impact equivalent to 24 tonnes of carbon dioxide for the activities included in the calculation.
It doesn't necessarily mean that exactly 24 tonnes of carbon dioxide were physically released at the event venue. The total may include emissions associated with travel, suppliers, electricity and other activities taking place beyond the venue itself.
If you'd like to understand how activity information is converted into emissions estimates, our guide to emission factors explains the underlying concept.
What does emissions per attendee tell you?
An emissions-per-attendee figure provides another way to understand the scale of your results.
It relates the total reported footprint to the number of attendees, helping you put the event's emissions into context.
This can be useful when reviewing events of different sizes, but it shouldn't be treated as a complete measure of performance. Two events with similar attendance may have very different locations, programmes, production requirements or travel patterns.
It's also worth checking that the attendance information and emissions included in the calculation are appropriate for the comparison you're making.
What are Scope 1, 2 and 3 emissions?
You may also see Scope 1, 2 and 3 mentioned in your carbon report.
These categories describe different relationships between an organisation and its emissions:
Scope 1: Direct emissions from sources owned or controlled by the reporting organisation.
Scope 2: Indirect emissions from purchased electricity, steam, heating or cooling.
Scope 3: Other indirect emissions across the organisation's value chain.
For an event, activities such as attendee travel and supplier services may fall within relevant Scope 3 categories, depending on the reporting organisation and the accounting boundary.
If these terms are unfamiliar, our practical guide to Scope 1, 2 and 3 emissions explains them in more detail.
Step 2: Understand Your Event's Emissions Breakdown
Once you've reviewed the headline figures, move to the Emissions Breakdown.
This section helps you understand how the total carbon footprint is distributed across the different activities included in your event report.
Scope displays the results visually, making it easier to see which modules contribute the largest shares of emissions.
Depending on the information recorded, these can include:
Energy and Water
Guest Travel and Accommodation
Staff Travel and Accommodation
Production and Build
Supplier Logistics, Travel and Accommodation
Catering
Waste Management
Other recorded event activities
An international conference, for example, may have a different emissions profile from a local exhibition. The mix of travel, energy, production and supplier activities will influence the results.

How should you interpret the percentages?
Imagine that travel accounts for 60% of your event's measured emissions.
This means travel contributes 60% of the total footprint represented in the report. It doesn't mean that 60% of attendees used a particular transport method, or that travel emissions could automatically be reduced by 60%.
Percentages describe the relative contribution of each activity. They can help you identify emissions hotspots, which are the areas responsible for the largest shares of the measured footprint.
A large percentage isn't necessarily a sign that something has been managed poorly. It may simply reflect the nature, location or scale of the event.
Understanding your carbon footprint means looking at the reasons behind the figures rather than judging an activity by its percentage alone.
For example, if attendee travel is a major contributor, you might find our guide on tracking attendee travel emissions for events useful when considering how to collect more detailed information next time.
Step 3: Explore the Individual Module Results
The next stage of reading a carbon report is to look beyond the overall figures.
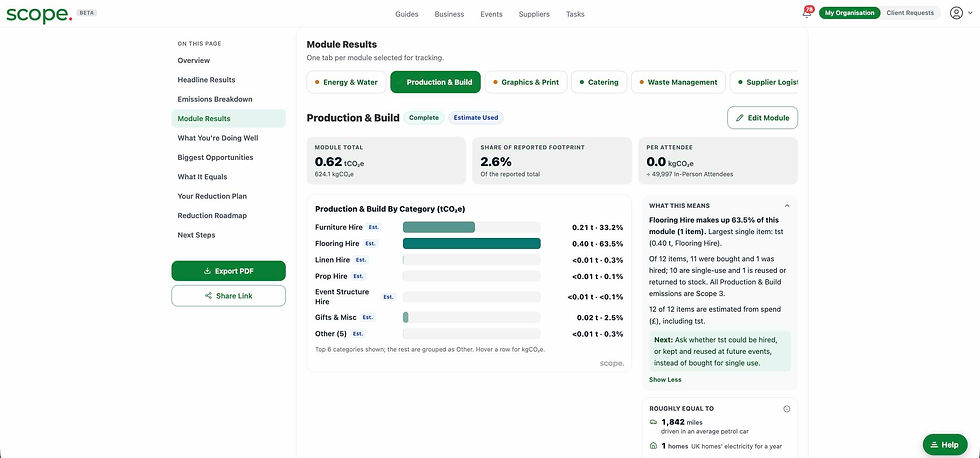
Scope's Module Results section allows you to review the individual event activity categories and explore the information contributing to each result.
In the report shown, modules include Energy & Water, Production & Build and Supplier Logistics, Travel & Accommodation, alongside other event categories.
The completed module views display information such as:
The module's estimated total emissions.
Its percentage contribution to the overall event footprint.
A per-attendee result.
A breakdown of emissions by recorded activity or source.
Additional contextual information associated with the module.
These details help explain why one category contributes more than another.
What should you look for?
Start with the largest modules identified in the emissions breakdown.
For example, if Production & Build contributes a significant share of your event footprint, you can explore the activities represented within that module rather than treating production as a single unexplained figure.
Similarly, the Supplier Logistics, Travel & Accommodation module can help you understand the contribution of recorded supplier-related activities.
As you review the module results, ask:
Which activities account for the largest share of emissions?
Does the recorded information reflect what happened at the event?
Are there important activities we haven't yet included?
Have we used estimates where direct activity information wasn't available?
What information could we collect more accurately next time?
What if a module has no data?
In the Scope recording, one travel module displays “No Data Entered Yet”.
This is an important distinction when interpreting carbon footprint results.
A module without entered data doesn't necessarily mean that the activity generated no emissions. It means the relevant information hasn't been recorded in that module.
For example, if guest travel information hasn't been collected, you shouldn't assume guests produced no travel emissions.
An incomplete report can still help you understand the activities that have been measured, but its limitations should be acknowledged when interpreting or sharing the findings.
If you're using estimates or need to improve the information available, our articles on estimating carbon emissions and improving carbon data provide further guidance.
Step 4: Understand What Your Carbon Report Is Telling You
A useful way to approach carbon footprint analysis is to separate what a figure tells you from what it doesn't.
This is particularly helpful when you're reading your first event carbon report, because percentages and totals can look more definitive than the underlying data allows.
Report result | What it tells you | What it doesn't tell you |
Total tCO₂e | Estimated emissions from the activities included | That every event-related emission has been captured |
Emissions per attendee | Reported emissions relative to attendance | Whether the event is automatically better or worse than another |
Largest module | The biggest recorded contributor | That the activity has been managed badly |
Module percentage | The category's share of reported emissions | How much could definitely be reduced |
Missing module data | Information hasn't been entered for that module | That the activity produced zero emissions |
Suggested opportunity | An area worth investigating | A guaranteed emissions reduction |
The purpose of this analysis isn't to find a perfect score. It's to understand your results well enough to make informed decisions.
Your first carbon footprint report is also a useful opportunity to recognise where your data collection process could improve. You don't need to have every answer immediately to start learning from the information you already have.
Step 5: Review What You're Doing Well
After the detailed module results, Scope includes a What You're Doing Well section.
This highlights positive findings based on the information entered into the platform.
In the demonstration report, for example, Scope identifies a completed supplier data activity as a positive finding.
This can be useful when reviewing how your event team collected information and worked with suppliers.
Understanding an event's carbon footprint isn't only about identifying areas to change. It's also about recognising useful practices that could be continued or developed.
However, a positive finding doesn't automatically mean that an activity has no emissions or that the event is environmentally sustainable overall.
Think of this section as an opportunity to recognise what has been recorded or completed successfully, while keeping the wider carbon footprint in perspective.
For events involving multiple contractors, our article on tracking your Scope 3 supply chain for events explores why supplier information matters.

Step 6: Identify Your Biggest Opportunities
Scope's Biggest Opportunities section highlights areas of the report that may deserve further attention.
In the demonstration report, Energy & Water and Supplier Logistics, Travel & Accommodation appear among the opportunities identified.
This helps connect the carbon footprint results with questions that event organisers can investigate when planning future events.
For example, a substantial Energy & Water contribution might prompt you to review venue electricity information, equipment requirements or temporary power arrangements.
A significant supplier logistics contribution might encourage a closer look at transport distances, delivery arrangements or the information collected from suppliers.
These are areas to explore rather than promises of emissions savings.
How should you prioritise opportunities?
Consider three things:
Potential impact: Which changes might make a meaningful difference to your measured emissions?
Practicality: Which options are realistic for your event, suppliers and budget?
Evidence: What information would help you assess whether a change is worthwhile?
You don't need to tackle every opportunity at once. Choosing a few areas that are relevant and achievable can make the results easier to act upon.
For example, if travel is an important part of your footprint, you could explore our event guest travel strategies for ideas to consider during future planning.
Suggested screenshot: Scope's Biggest Opportunities section, showing the highlighted event modules.
Step 7: Understand the “What It Equals” Comparisons
Carbon emissions figures can be difficult to picture, especially when you're looking at tonnes of CO₂e for the first time.
To make the scale easier to communicate, Scope includes a section called Your Overall Event Footprint - What It Equals.
In the demonstration report, this section presents comparisons involving car miles, trees and homes.
These examples are designed to help readers visualise the size of the reported carbon footprint using more familiar references.
How should you interpret these comparisons?
The important thing to remember is that these are illustrative equivalences, not separate measurements of your event.
For example, a comparison with car miles doesn't mean those journeys actually took place. Similarly, a tree-related comparison doesn't mean trees have been planted or that the event's emissions have been offset.
These comparisons can be helpful when explaining your results to colleagues or clients who aren't familiar with tCO₂e.
However, the carbon footprint figure itself, together with its calculation assumptions and reporting boundary, remains the more important information for understanding the event's measured emissions.
Use the equivalences to communicate scale, rather than as evidence of emissions reductions or environmental benefits.
Suggested screenshot: Scope's “Your Overall Event Footprint – What It Equals” cards.
Step 8: Turn Your Results Into a Reduction Roadmap
Once you've explored the figures, the next question is what to do with them.
Scope's event report includes a Reduction Roadmap section, followed by Next Steps guidance.
These sections help connect the report's findings with further planning and data collection.
A practical approach is to divide your next steps into three areas.

Improve the information you collect
Review any incomplete modules or activity estimates and consider where more detailed information could be obtained.
For example, you might want to gather more accurate attendee travel information, request additional supplier activity data or improve how energy consumption is recorded.
Explore realistic changes for future events
Use the largest emissions sources and highlighted opportunities to identify possible changes.
Depending on the event, this could involve transport arrangements, venue selection, production requirements, supplier logistics or catering choices.
The aim is to assess which options are practical and potentially meaningful, rather than assuming every recommendation will lead to a particular reduction.
Plan how you'll assess progress
Think about the information you'll need to collect at your next event to understand whether changes have made a difference.
When comparing reports, remember that attendance, event duration, location, activities and data completeness can all affect the results.
For example, an event with fewer attendees may have a lower total footprint without necessarily having lower emissions per attendee.
Understanding these differences makes future comparisons more useful.
Suggested screenshot: Scope's Reduction Roadmap and Next Steps sections.
Step 9: Export and Share Your Event Carbon Report
Once you've reviewed the results, you may want to share the report with colleagues, clients or other stakeholders.
Scope's event reporting interface includes Export PDF and Share Link options.
These provide ways to make the report available for further discussion and review.
Before sharing the results, make sure the people reading them understand the context.
It's helpful to explain which event was measured, which activities were included, whether important data is missing and what the main findings mean.
For example, instead of simply saying that travel was responsible for most of the event's emissions, you could explain which travel activities were recorded and whether any important information was unavailable.
This makes the carbon footprint report more informative and helps prevent the figures being interpreted without their limitations.
How Scope Carbon Tracking Helps You Understand Your Event Carbon Report
Scope Carbon Tracking's event reporting platform brings together the emissions information entered for an event and presents the results in a structured report.
As shown in the report walkthrough, you can move from the overall footprint to the individual activity modules, review positive findings, identify areas worth investigating and explore the Reduction Roadmap and Next Steps sections.
The Headline Results help you understand the overall picture, while the Emissions Breakdown and Module Results provide more detail about where the recorded emissions come from.
The What You're Doing Well and Biggest Opportunities sections provide additional context, and What It Equals offers illustrative comparisons to help communicate the scale of the footprint.
These features support the process of understanding event emissions and planning further action. They don't, by themselves, guarantee emissions reductions, establish that an event is sustainable or replace the need to review the completeness of the underlying data.
If you're beginning to measure your events, you can explore Scope's Event Carbon Tracking platform or learn more about getting started with the Event Carbon Calculator.
Frequently Asked Questions About Reading a Carbon Report
How do you read a carbon report for the first time?
To read a carbon report, start with the total footprint in tCO₂e, then review the largest emissions sources and the activity-level results. Check which data has been included, identify any gaps and use the findings to decide which areas deserve further investigation. For an event, it helps to understand the report in the context of attendance, location, duration and activities.
What is the most important figure in a carbon footprint report?
The total carbon footprint is a useful starting point, but it shouldn't be interpreted on its own. The largest emissions categories, reporting boundary and completeness of the activity data are equally important for understanding what the results mean.
How can you understand a carbon report if you're new to sustainability?
Understanding a carbon report becomes easier when you work through it in stages. Begin with the headline results, learn what tCO₂e means, review the breakdown of emissions and explore the individual activity categories. You can then look at the report's findings and identify practical next steps without needing to become a carbon accounting specialist.
What does carbon footprint analysis tell you about an event?
Carbon footprint analysis helps you understand which recorded activities contribute to an event's estimated greenhouse gas emissions. It can highlight significant emissions sources, reveal information gaps and support decisions about what to investigate when planning future events.
Can you compare carbon footprint reports from different events?
Carbon footprint reports can be compared, but the comparison needs context. Differences in attendance, event duration, venue, location, activities and reporting boundaries can all affect the results. Comparing totals alone may not provide a reliable picture of changes in performance.
What if your event carbon report contains estimated data?
An event carbon report can still provide useful information when some results are estimated. The important thing is to understand which assumptions were used, whether they are appropriate and where more accurate activity data could improve future calculations.
Does a carbon report show that an event is sustainable?
A carbon report provides information about the greenhouse gas emissions included in an assessment. It doesn't independently establish that an event is sustainable, carbon neutral or free from environmental impacts. It can, however, support a more informed approach to measuring emissions and considering future improvements.
Make Your First Carbon Report a Starting Point
Learning how to read a carbon report gives you a clearer understanding of the emissions associated with your event and the activities contributing to them.
Your first report doesn't need to answer every question. It can help you recognise what you've measured, understand where more information is needed and decide which opportunities are worth exploring next.
With Scope Carbon Tracking, you can review your event's headline results, explore its activity breakdown, understand the findings and use the report to inform future planning.
If you're ready to start measuring and understanding your event's carbon footprint, explore Scope Event Carbon Tracking.


Comments